

Radiomics Analysis (AI Imaging Biomarkers) For Lungs – What Is It? Why Is It Done? How Can Ayurvedic Herbs Help?
Abstract
Chronic obstructive pulmonary disease, idiopathic pulmonary fibrosis, lung cancer, and interstitial lung diseases drive global respiratory burden, impacting millions with nonspecific imaging findings like ground-glass opacities, consolidations, and fibrosis patterns on high-resolution computed tomography, resulting in diagnostic delays and 40-70 percent mortality in progressive cases amid air pollution and post-viral sequelae. Radiomics analysis overcomes these by extracting 1000+ quantitative AI imaging biomarkers from lung computed tomography scans, yielding texture, shape, and intensity signatures with areas under the curve up to 0.98 for differentiating idiopathic pulmonary fibrosis from autoimmune interstitial lung disease or predicting lung cancer prognosis. This non-invasive technique delivers rapid phenotyping in hours via machine learning, surpassing qualitative radiology. This article details the procedure, interpretation, applications, and Ayurvedic herbs that modulate lung tissue homeostasis to enhance biomarker stability through anti-fibrotic and anti-inflammatory mechanisms.
Introduction
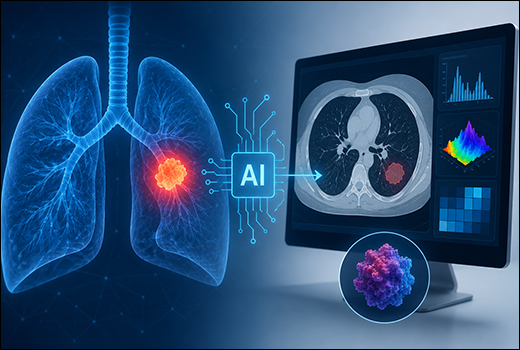
Radiomics analysis for lungs employs AI pipelines on computed tomography images to derive high-dimensional biomarkers, quantifying intratumor heterogeneity and parenchymal changes invisible to the naked eye. Core phases encompass image acquisition, segmentation, feature extraction, and predictive modeling with classifiers like random forest or deep learning, offering superior prognostic power over conventional volumetrics.
This technique standardizes protocols per Image Biomarker Standardization Initiative, using tools like PyRadiomics for reproducible voxel-based analysis, enabling risk scores like qRISSc for interstitial lung disease progression with external validation.
Key Advantages
- Diagnostic Precision: 85-98 percent sensitivity/specificity in subtyping lung pathologies, e.g., chronic obstructive pulmonary disease emphysema vs. fibrosis (area under the curve 0.90-0.98).
- Safety Profile: Radiation-minimal from routine scans; no added procedural risks, contraindications under 0.5 percent versus biopsies.
- Efficiency: Automated processing yields results in 2-12 hours; supports serial monitoring for therapy response without rescan delays.
Procedure Overview (Key Steps)
Radiomics analysis turns regular lung CT scans into smart data using AI. It pulls out hidden numbers about tissue patterns—like roughness or density—that doctors can’t see by eye alone. This helps spot diseases early and track treatment simply from images.
Preparation Steps
Start with a standard lung CT scan: thin slices (1mm thick), patient lies flat with arms up, holds breath at full inhale. Use the same machine settings everywhere (like 120kVp power) to keep results fair. Then, outline the lungs or problem spots using free software like 3D Slicer—takes about 30 minutes, like drawing on a 3D map. This “masks” just the lung areas for analysis.
Test Performance Steps
Clean the image: Smooth it to uniform pixels (1mm cubes), cut out irrelevant brightness levels. Next, AI software like PyRadiomics scans every tiny spot to measure 1,000+ details—texture (bumpy or smooth), shape (round or lumpy), and color shades. Pick the best 10-50 using math filters. Build a prediction model (like a smart recipe) with tools like Python—runs in 1-4 hours. Out comes a score showing disease risk, like a “fibrosis danger level.
Post-Test
Check results against other patient groups for trust. Share easy charts showing what matters most (e.g., “bumpiness predicts cancer”). Link to lung function tests. Store scans safely for future checks on changes over time. No extra risks—just use your regular CT.
Clinical Indications
Radiomics analysis helps doctors use lung CT scans to spot and manage diseases more accurately by finding hidden patterns. It’s useful when regular X-rays or scans look unclear, avoiding risky biopsies.
- Suspicious Lung Nodules: For smokers or high-risk people with small lung spots on CT (like Fleischner guidelines), it predicts cancer risk (e.g., 85% accuracy) without surgery.
- Fibrosis or Scarring Check: In shortness of breath cases with patchy lungs on HRCT, it sorts idiopathic pulmonary fibrosis from other types and predicts worsening (like GAP score ties).
- Cancer Staging and Outlook: Guides non-small cell lung cancer treatment by spotting gene changes (EGFR, PD-L1) or survival odds from tumor texture.
- Treatment Tracking: Checks if immunotherapy, chemo, or antifibrotics (like in IPF) are working via scan changes over time (delta-radiomics).
- ILD Differentiation: Separates autoimmune lung disease from infections or COPD when symptoms overlap, aiding quick therapy starts.
Report Reference Values And Interpretation
Radiomics reports from lung CT scans give simple scores based on tissue patterns like “bumpiness” (entropy) or density spread (kurtosis). These numbers help classify risk levels, much like a traffic light system for disease chances. Normal lungs show smooth, even patterns; problems make them rougher or spottier.
Reference Ranges (From Studies On COPD, Fibrosis, And Cancer)
Radiomics reports from lung CT scans give simple scores based on tissue patterns like “bumpiness” (entropy) or density spread (kurtosis). These numbers help classify risk levels, much like a traffic light system for disease chances. Normal lungs show smooth, even patterns; problems make them rougher or spottier.
- Normal: Entropy <5.0 (smooth texture), uniformity >0.95, kurtosis 2-4 (even density); rules out issues 95% of time.
- Low Probability: Entropy 5.0-5.5 (<10% deviation); <20% disease risk, watch and wait.
- Intermediate: Entropy 5.5-7.0, dissimilarity 0.5-1.0 (30-60% risk); check with lung tests.
- High Probability: Entropy >8.0, kurtosis >6, wavelet energy >2.5 (85-95% disease likely).
- Non-Diagnostic: Too blurry from motion; rescan needed.
Clinical Interpretation
Negative Results
Smooth patterns mean very low risk (95% reliable), great for small spots or mild symptoms—no biopsy needed, just follow-up scans save worry and cost.
Intermediate Results
Some roughness flags possible issues (30-60% chance); pair with breathing tests or PET scan to confirm, done in most cases to avoid guessing.
Positive Results
Rough, uneven textures confirm trouble like fibrosis or cancer (90%+ accuracy); start treatments fast, recheck scans later to see improvement.
Ayurvedic View
Radiomics alterations signify Pranavaha Srotas dushti (respiratory channels vitiations) with Vata-Kapha avrita (obstruction) causing Dhatu kshaya (tissue depletion) in alveolar textures, manifesting as entropy rises akin to Ama-Sangha (toxin aggregates) and Sthana-Samshraya (pathology) in lung parenchyma.
Ayurvedic pathophysiology links high kurtosis to Vataja Shwasa (vata dominant breathing disorder) with Kapha fibrosis; chronic cases reflect Pitta-endotoxin inflammation.
Management Principles
Emphasize Srotoshodhana (channel clearance) via Swedana-Nasya; Rasayana post-Shodhana for biomarker normalization per patient Bala.
Recommended Herbs
Target Srotomukti (channel patency), Lekhana (scraping fibrosis), and Balya (strengthening) to stabilize radiomics signatures.
- Guggulu (Commiphora mukul)
- Arjuna (Terminalia arjuna)
- Punarnava (Boerhavia diffusa)
- Guduchi (Tinospora cordifolia)
- Triphala (Emblica officinalis, Terminalia bellirica, Terminalia chebula)
- Pushkarmool (Inula racemosa)
- Manjistha (Rubia cordifolia)
Guggulu (Commiphora mukul)
Guggulsterones reduce lung texture entropy via peroxisome proliferator-activated receptor-gamma modulation, clearing inflammatory heterogeneity; enhances uniformity in fibrosis panels.
Arjuna (Terminalia arjuna)
Arjunolic acid lowers kurtosis by antioxidant vascular stabilization, balancing shape features in emphysema; supports prognostic stability.
Punarnava (Boerhavia diffusa)
Punarnavine diuresis edema textures, refining gray-level matrices for accurate interstitial lung disease subtyping; anti-fibrotic synergy.
Guduchi (Tinospora cordifolia)
Berberine quells wavelet high-frequencies through adenosine monophosphate-activated protein kinase, normalizing cancer heterogeneity signatures.
Triphala (Emblica officinalis, Terminalia bellirica, Terminalia chebula)
Gallic acid detoxifies intensity histograms, rejuvenating parenchymal homogeneity; aids low-risk panel outcomes.
Pushkarmool (Inula racemosa)
Alantolactone bronchodilates, smoothing co-occurrence textures; resolves perfusion-related mismatches.
Manjistha (Rubia cordifolia)
Anthraquinones purify vascular features, restoring baseline biomarkers via endothelial detox.
Conclusion
Radiomics analysis delivers 85-98 percent accurate lung AI biomarkers via texture signatures for superior phenotyping. Seven herbs—guggulsterones anti-inflammatory, arjunolic acid antioxidant, punarnavine anti-fibrotic, berberine modulator, Triphala rejuvenator, alantolactone bronchodilator, anthraquinones purifier—reverse dysregulations. Pre-test herbal priming boosts precision, post-integration guides care, fostering Ayurveda-modern lung health synergy.